


Graphical CPU utilization and monitoring tool
The top_view package is a tool using the tracing infrastructure of Genode to gather thread related information, e.g. execution time, and prepare them for graphical presentation. I already develop it for a while beginning with the early Sculpt versions. In the last weeks I extended it in my leisure time with some extra features, with the goal to selectively monitor behaviour of components of interest over some time. The main impulse was triggered during the work on audio on Sculpt, where I missed a basic online tool that supports me to get better insights into some behaviour of the system.
In this post I'm going to describe the current (19.04 version) state of the top_view tool and its usage. Since I'm not a GUI developer, I fear some guidance is necessary... The top_view tool you may find and download from my alex-ab depot:
 +
   -> Depot
      -> alex-ab
        -> Tools
          -> top_view
On startup you will have to connect the top_view package with a GUI service, permit access to the tracing infrastructure of Genode and to the fonts fs service, available in the genodelabs depot.
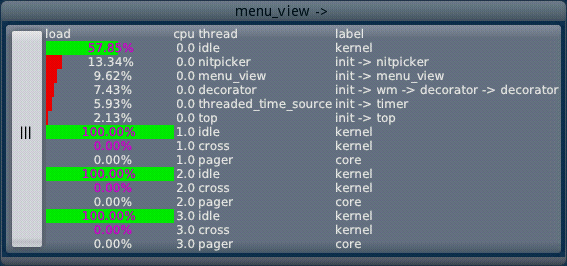
When the tool starts up, you will get to the initial thread view:
|
The thread view presents you the threads with the top most CPU utilization per CPU. The view is updated in a configurable period (see below). The label column contains the component name and the parent relationship. A click on the stretched left button will lead you to the configuration view:
|
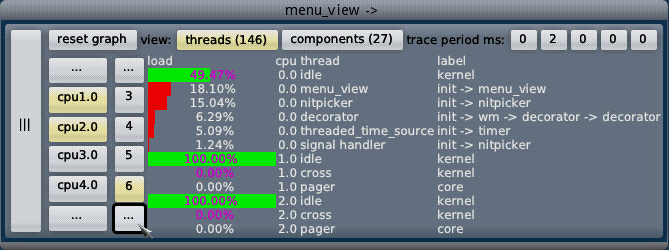
The left column with the cpu names allows you to selective enable/disable the display of utilization information of a specific CPU. The column right aside with just the numbers allows you to select how many entries per CPU are shown. Both columns you may scroll up/down by using the ... buttons or the scroll wheel of the mouse.
In the upper right you may change the rate of requesting and updating the trace data. The 5 buttons represent 5 digits of the configurable period range of 1 to 99999 ms. Left clicks increase the respective digit, right clicks decrease it.
You may switch between the default thread and components view by selecting the respective buttons in the upper row. The numbers next to the buttons denote the overall count of threads and components (processes) in the running Genode system. Selecting the component view, you will get to the next view:
|
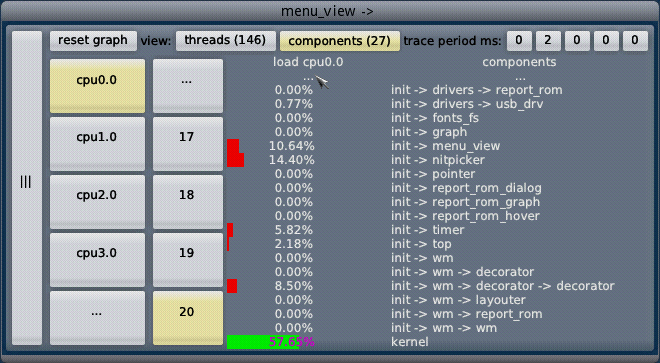
In the components view all components (processes) are listed. You may scroll up/down by using the ... entries or the scroll wheel. According to the selected CPU in the left column, the overall utilization of the threads of a component on the specific CPU is shown. By changing the CPU, you may get the utilization of the other component threads on that specific CPU. The column with just the numbers allows you to select how many components at once are shown.
A click on the thread and label names will lead you to the detailed component view:
|
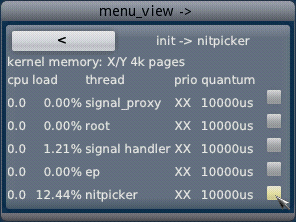
In the detailed component view you get information specific to a selected component. The view presents you all threads of a component and the CPU affinity of them. Additionally, further information regarding scheduling, like priority and quantum, and kernel memory usage can be available. (It is in a developer version already, but the feature request for upstream got not considered yet.)
The checkbox next to each thread will mark a thread to be tracked over some time. Toggling such a checkbox leads you to an additional graph window:
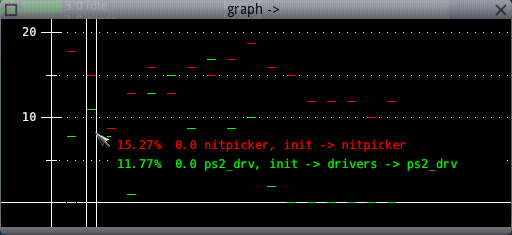
|
The graph window shows all tracked threads and their CPU utilization per reading point. The vertical scale denotes the utilization in percent and will be adjusted automatically to the utilization of the tracked threads. Hovering above one reading point with the mouse pointer shows the thread and utilization information in place. The graph window is resizeable and can be adjusted dynamically by you.
You may selective de-select tracked threads in the detailed component view or may de-select all threads at once by using the reset graph button in the configuration view. Whenever no threads are selected for tracking, the graph window will disappear.
Known issues
The window size of the menu is sometimes not adjusted correctly after switching views. A click on the lower right window decoration leads to the right size, typically. Sometimes, when you scroll down quickly, the menu view is not updated completly. If you are just patience, it will be with the next redraw, typically.
Top_view background
The top view package consists of three Genode components running in a sub init. The top component gather the trace data and prepare it for the other two components, the' menu_view' and the graph. Top generates in the configured period Genode reports understood by the menu_view and by the graph component. The menu_view is a modified version of the menu_view as used also in the Leitzentrale and shows the thread, component, configuration and detailed view. The graph component is a native GUI/Nitpicker client which presents you with the second window about the tracked threads.