


Graphical CPU utilization and monitoring tool (19.12)
The top_view component is a tool using the tracing infrastructure of Genode to gather thread related information, e.g. execution time, and prepare them for graphical presentation. Lately the tool got some updates I want to share. Beside the textual post I also uploaded a short tutorial video. In order to test the current version, you will have to build the Sculpt OS image yourself.
In this post I'm going to describe the current - 19.12 version - of the top_view component and its usage. The top_view tool you may find and download from my alex-ab depot:
 +
   -> Depot
      -> alex-ab
        -> Tools
          -> top_view
          -> top_view_storage
On startup you will have to connect the top_view package with a GUI service, permit access to the tracing infrastructure of Genode and to the fonts fs service, available in the genodelabs depot. The top_view_storage variant additionally needs access to a file system in order to store the traced data.
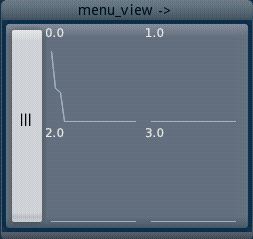
When the tool starts up, you will get to the initial view:
|
The initial view shows per CPU a tiny graph to indicate some ongoing activity on the CPUs without much detail. By selecting the left configuration button, you get to thex next view.
|
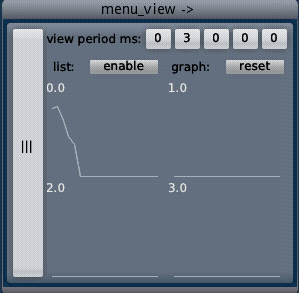
In this view you may adjust the rate of how often the CPU utilization is measured and updated. The digits of the rate can be changed by left and right mouse clicks which increases or decreases the update rate. By selecting the enable button of the list view, you get to the following view:
|
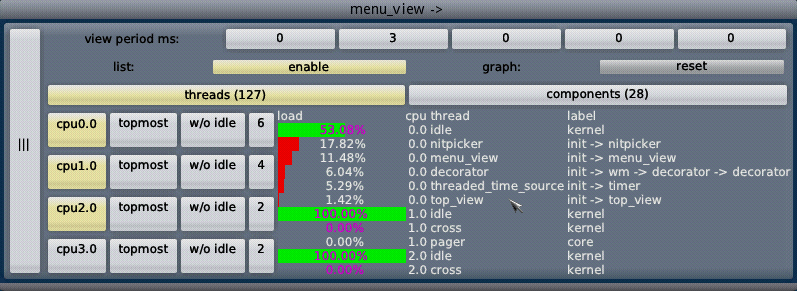
The threaded list view on the right presents you the threads with the top most CPU utilization per CPU. The number of shown threads can be configured per CPU separately by increasing the number in the specific row. You may also disable showing some CPUs by de-selecting the associated named CPU button. Most olumns you may scroll up/down by using the ... buttons or the scroll wheel of the mouse.
You may switch between the default thread and components view by selecting the so named buttons. The numbers next to the buttons denote the overall count of threads and components (processes) in the running Genode system.
|
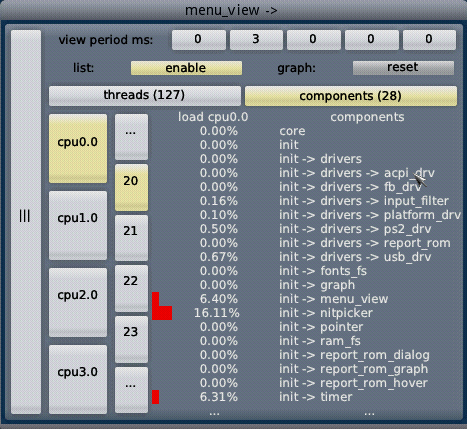
In the components view all components (processes) are listed. You may scroll up/down by using the ... entries or the scroll wheel. According to the selected CPU in the left column, the overall utilization of the threads of a component on the specific CPU is shown. By changing the CPU, you may get the utilization of the other component threads on that specific CPU. The column with just the numbers allows you to select how many components at once are shown.
A click on the thread and label names will lead you to the detailed component view:
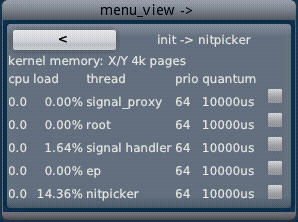
|
In the detailed component view you get information specific to a selected component. The view presents you all threads of a component and the CPU affinity of them. Additionally, further information regarding scheduling, like priority and quantum usage is available. The kernel memory usage is not yet available in Genode upstream.
The checkbox next to each thread will mark a thread to be tracked over some time. Toggling such a checkbox leads you to an additional graph window:
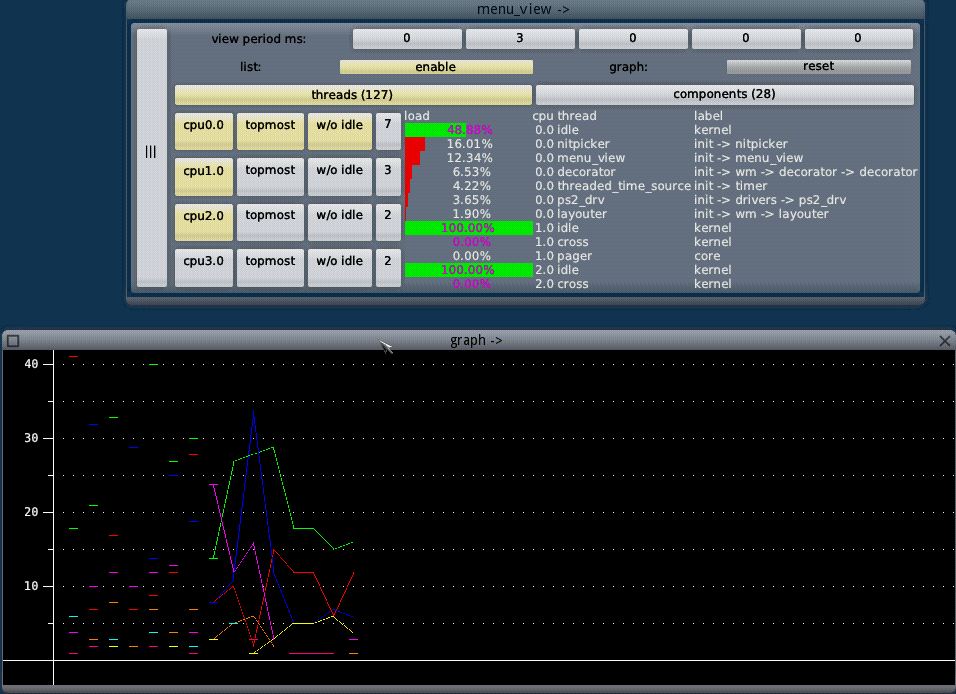
|
The graph window shows all tracked threads and their CPU utilization per reading point. The vertical scale denotes the utilization in percent and will be adjusted automatically to the utilization of the tracked threads. Hovering above one reading point with the mouse pointer shows the thread and utilization information in place. The graph window is resizeable and can be adjusted dynamically by you.
You may selective de-select tracked threads in the detailed component view or may de-select all threads at once by using the reset graph button in the configuration view. Whenever no threads are selected for tracking, the graph window will disappear.
Top_view background
The top view package consists of three Genode components running in a sub init. The top component gather the trace data and prepare it for the other two components, the' menu_view' and the graph. Top generates in the configured period Genode reports understood by the menu_view and by the graph component. The menu_view is a modified version of the menu_view as used also in the Leitzentrale and shows the thread, component, configuration and detailed view. The graph component is a native GUI/Nitpicker client which presents you with the second window about the tracked threads.
The latest source code is available on github/alex-ab in branches named sculpt_pkg_top_view_<date>, e.g. sculpt_pkg_top_view_19_12 for the current version.